2007 Top 10 Chart Runs Graph
This interactive visualization shows the Billboard Hot100 chart runs for the top ten songs of the year according to our Chartcrush ranking. Here you can see when songs charted during the year, for how long, and the strength of each song’s chart run relative to the other songs in the yearly top ten.
Hover over the legend to highlight a song in the plot area. Hover over a line in the plot area to see the song title and weekly rank.
1965 Top 10 Chart Runs Graph
This interactive visualization shows the Billboard Hot100 chart runs for the top ten songs of the year according to our Chartcrush ranking. Here you can see when songs charted during the year, for how long, and the strength of each song’s chart run relative to the other songs in the yearly top ten.
Hover over the legend to highlight a song in the plot area. Hover over a line in the plot area to see the song title and weekly rank.
1958 Top 10 Chart Runs Graph
This interactive visualization shows the chart runs for the top 13 songs of the year (since there are ties at positions 6, 7 and 8) according to our Chartcrush ranking. Here you can see when songs charted during the year, for how long, and the strength of each song’s chart run relative to the other songs in the yearly top ten.
From August 4 on, the graph shows positions on the Hot100. Prior to August 4, the graph shows the weekly chart positions derived by combining songs’ action on the separate survey-based Best-Sellers in Stores and Most Played by by Disk Jockeys charts, with equal weight given to each. Ties occur when songs’ point sums from the two charts are identical in a given week.
Hover over the legend to highlight a song in the plot area. Hover over a line in the plot area to see the song title and weekly rank.
1971 Top 10 Chart Runs Graph
This interactive visualization shows the Billboard Hot100 chart runs for the top ten songs of the year according to our Chartcrush ranking. Here you can see when songs charted during the year, for how long, and the strength of each song’s chart run relative to the other songs in the yearly top ten.
Hover over the legend to highlight a song in the plot area. Hover over a line in the plot area to see the song title and weekly rank.
1997 Top 10 Chart Runs Graph
This interactive visualization shows the Billboard Radio Songs (Airplay) chart runs for the top ten songs of the year according to our Chartcrush ranking. Here you can see when songs charted during the year, for how long, and the strength of each song’s chart run relative to the other songs in the yearly top ten.
Hover over the legend to highlight a song in the plot area. Hover over a line in the plot area to see the song title and weekly rank.
1986 Top 10 Chart Runs Graph
This interactive visualization shows the Billboard Hot100 chart runs for the top ten songs of the year according to our Chartcrush ranking. Here you can see when songs charted during the year, for how long, and the strength of each song’s chart run relative to the other songs in the yearly top ten.
Hover over the legend to highlight a song in the plot area. Hover over a line in the plot area to see the song title and weekly rank.
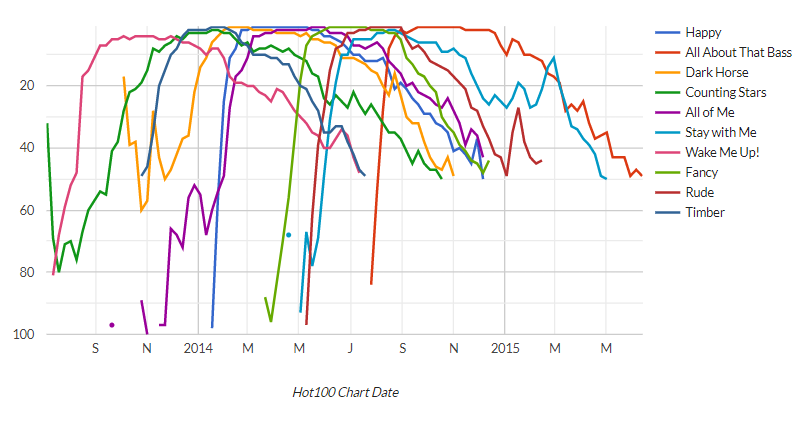
2013 Top 10 Chart Runs Graph
This interactive visualization shows the Billboard Hot100 chart runs for the top ten songs of the year according to our Chartcrush ranking. Here you can see when songs charted during the year, for how long, and the strength of each song’s chart run relative to the other songs in the yearly top ten.
Hover over the legend to highlight a song in the plot area. Hover over a line in the plot area to see the song title and weekly rank.
1951 Top 10 Chart Runs Graph
This interactive visualization shows the chart runs for the top ten songs of the year according to our Chartcrush ranking. Here you can see when songs charted during the year, for how long, and the strength of each song’s chart run relative to the other songs in the yearly top ten.
Hover over the legend to highlight a song in the plot area. Hover over a line in the plot area to see the song title and weekly rank.
For pre-Hot100 years, the weekly chart positions shown are derived by combining songs’ action on the separate survey-based Best-Sellers in Stores, Most Played by by Disk Jockeys and Most Played on Jukeboxes charts published each week in Billboard in the pre-Hot100 era (1940-1958). Equal weight is given to each of these three charts, so ties occur when songs’ point sums from the three charts are identical in a given week.
2004 Top 10 Chart Runs Graph
This interactive visualization shows the Billboard Hot100 chart runs for the top ten songs of the year according to our Chartcrush ranking. Here you can see when songs charted during the year, for how long, and the strength of each song’s chart run relative to the other songs in the yearly top ten.
Hover over the legend to highlight a song in the plot area. Hover over a line in the plot area to see the song title and weekly rank.
1989 Top 10 Chart Runs Graph
This interactive visualization shows the Billboard Hot100 chart runs for the top ten songs of the year according to our Chartcrush ranking. Here you can see when songs charted during the year, for how long, and the strength of each song’s chart run relative to the other songs in the yearly top ten.
Hover over the legend to highlight a song in the plot area. Hover over a line in the plot area to see the song title and weekly rank.